Absent active interventions such as injecting CO2 gas, having an ‘active substrate’ and the metabolic processes of fish and plants, the pH of an aquarium will equilibrate to a level mostly determined by the alkalinity of the water – the amount of externally supplied bicarbonate and carbonate ions. In most cases, “externally supplied” means came along for the ride in tap water. Atmospheric CO2 and CO2 dissolved in the aquarium water will reach a balanced relationship described by Henry’s law1 which modulates subsequently the amount and ratio of bicarbonate and carbonate ions and collectively determines the pH of the water.
I noticed that after a water change, the Shrimphaus had a lower than equilibrium pH and the pH returned to normal after about four hours, but what is driving that change and exactly how long does it take?
How long does it take for aquarium pH to stabilise?
In this case, the Shrimphaus pH was lowered due to the CO2 gas dissolved in pressurised Cambridgeshire tap water where the additional dissolved CO2 lowers the pH through formation of carbonic acid. That excess CO2 in the Shrimphaus water, relative to the levels driven by Henry’s law, will “degas” by diffusing out of the water and into the atmosphere. The rate at which this happens is described by Fick’s law of diffusion, which roughly states that the rate of change at any given time is proportional to the excess dissolved CO2 in the water.

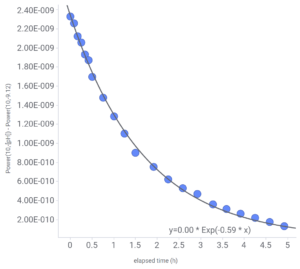
Since the rate of change of concentration of excess dissolved CO2 is proportional to the concentration of dissolved excess CO2, this change is a first order reaction. Accordingly, we expect the amount of excess CO2 left in the Shrimphaus at any given time after a water change to be described by an exponential decay type of relationship. I measured the pH of the water in the Shrimphaus at various times immediately after a water change, and sure enough, an exponential curve fit the data very well. In this case, I measured pH instead of CO2 and pH is measured on a logarithmic scale so to be proportional to CO2 we need to change the pH back to a linear scale, which is done instead using the hydronium ion (H3O+) concentration which relates to pH by [H3O+] = 10-pH. Curve fitting worked best in this instance using an equilibrium pH of 9.12. You can see that in the description of the Y-axis2 in Fig. 1. where I tried different values for the equilibrium pH and 9.12 fit the best. The rate constant k worked out to be 0.59 (h-1) so the half-life of the excess CO2 is ln(2)/k = 1.17 hours, or about 70 minutes3. That means every 70 minutes, half of the excess CO2 has diffused out of the water and into the atmosphere making the pH of the Shrimphaus gradually approach 9.12.
The rate of pH stabilisation is unique to each aquarium
The rate at which excess CO2 degases is also proportional to a large number of non-changing and individual aquarium specific factors including the surface area over which the gas exchange takes place, temperature, and the effective depth of the water – this latter will be influenced by water flow. Shrimphaus is a shallow tank and has good water flow throughout the tank and in particular across the river which I expect makes the effective surface area larger than it might seem. Potentially in a deep aquarium without much water flow the pH stabilisation could take much longer.
Notes
1 In theory Henry’s law is easy to calculate and apply, but in practice can be tricky to figure out because Henry’s law constants come in 8 different flavours of units and you need to be careful to get those matched up correctly.

2 In the curve fit equation y=Aoe–kt you can see Ao listed as 0.00. This is because the software I used to fit the curve doesn’t display curve fit values on the graph in scientific notation causing the Ao [H3O+] value of around 2.3e-9 to display as ‘0.00’. You can, however, export the curve fit values which does list them suitably in scientific notation and get the actual values that way.
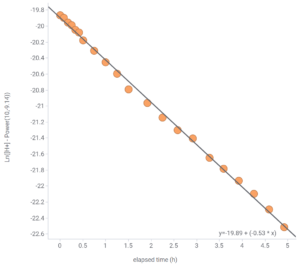
3 The other way you can derive k is to plot the CO2 excess on a logarithmic scale vs time. pH is already a logarithmic scale of course, but it is logarithmic to the base 10 and ordinarily we’d like to use the natural log (ln) rather than log10. Doing some conversion and then a linear fit to the resulting graph is shown in Fig. 2. The terminal pH modeled as 9.14 this way and k=0.53 yields a slightly different half-life of 1.3 hours = 78 minutes, in pretty good agreement with the direct fit to an exponential curve shown in Fig. 1.