
Alkalinity is an important parameter in a planted tank because alkalinity directly sets the baseline pH of the water. Some plants and animals are sensitive to pH levels, for example because higher pH increases the possibility of ammonia toxicity. Getting a rough alkalinity measurement is reasonably straightforward and in addition to abundant aquarium hobby alkalinity testing strips and kits there are also more sophisticated titration-based and quantitative colourimetric assays for either freshwater or saltwater available.
Mostly, the alkalinity measurement involves adding a defined amount of acid to a test sample – titrating the test sample – and monitoring what happens to the pH, either using a pH sensitive indicator dye or by monitoring pH with a glass electrode. The dyes are in principle straightforward: the Hanna kit uses bromophenol blue (BPB) which is blue in the presence of carbonate alkalinity shifting to yellow as the alkalinity gets used up. In the presence of carbonate alkalinity, BPB will be blue. Put some BPB in your test sample, add acid until the BPB changes from blue to yellow, then the alkalinity directly relates to how much acid you had to add to get the colour to change.
Sounds great and gives a good ballpark read, but isn’t really accurate with any samples and is even worse with low alkalinity samples. Fortunately it is pretty easy to do much better.
TLDR #1; ‘mixed indicator’ is much better than other pH indicator dyes
Mixed indicator was first published by Stancil S. Cooper in 1941 and has been the accepted standard colourimetric titration method ever since.
Mixed indicator is best for low alkalinity
Mixed indicator is a 5:1 mixture of bromocresol green (BCG) and methyl red (MR). I purchased the BCG and MR sodium salt powders from APC Pure and made up separate stocks of 0.1% dye in 50/50 w/w water/methanol. Pro tip: get the sodium salt versions of the dyes instead of the free acid forms to avoid solubility problems. Making a mixed indicator stock is then easy: 5 parts of BCG stock mixed with 1 part MR stock makes the 5:1 mixture at 0.1% total dye concentration. Store in amber/brown glass bottles with a tight stopper. Alternatively you can purchase premade mixed indicator for not a lot of money.
There are two reasons why mixed indicator is so effective:
- The colour transition of mixed indicator is very sharply delineated. Bright blue transitions through a dirty lavender intermediate to bright pink over a very narrow pH range centred at pH = 4.8. At pH 5.0 the dye is very clearly blue and at 4.6 the dye is very clearly pink. The sharp transition removes the colour interpretation guesswork other pH indicator dyes have.
- The pH range of informative colours is well matched to the titration endpoints you actually need to see, with pH = 4.8 pretty much right on the pH endpoint you want for most low alkalinity solutions.
Collectively, this means mixed indicator has an easily recognisable visual endpoint just where you want it to be.
TLDR #2; use ‘grey-lavender’ as the colour endpoint with high concentration BCG-MR mixed indicator
What seems like it should be straightforward can get complicated because…
The equivalence point pH depends on the starting alkalinity
The equivalence point is where the proton donating capacity of species such as carbonic acid H2CO3 exactly balances the proton accepting capacity of species such as CO32- and HCO3–. We’re trying to measure how much acid we need to add to a test sample with some starting alkalinity to get to this point. A subtlety that matters with low alkalinity solutions specifically is we also need to put H+ and OH– themselves onto this balancing ledger. If we want to be really accurate we also need to consider that the pH indicator dye we’re adding itself has some alkalinity – accepting protons is what makes it change colour. At these low levels of alkalinity, the pH change from CO2 diffusing into the sample passively from the atmosphere also turns out to not be negligible. We will take all of these factors into account.
Subtleties aside, the largest consideration is that the process converts starting alkalinity into carbonic acid which causes a pH change. If the test sample started with high alkalinity, then at the equivalence point there will be a ‘high’ amount of carbonic acid and the pH will be pretty low which makes measuring the pH change pretty easy. On the other hand, if the sample started with only a small amount of alkalinity, the equivalence point will have a small amount of carbonic acid and the pH change will be much more modest. This is where it’s possible to go wrong if the pH of the colour indicator is not a good match for the pH at the equivalence point – you can get to the equivalence point but not yet at the colour change, so you keep adding acid until the colour changes and that extra acid makes you overestimate the sample alkalinity.
Here is a chart of the equivalence point you’re looking for given a water sample’s starting alkalinity. The chart takes full account of H+ and OH– contributions, and assumes a standard indoor atmosphere of approximately 630 ppm CO2, which contributes 1 ppm H2CO3 in the water sample.
| Alkalinity (ppm) | Equivalence point pH |
|---|---|
| 0 | 5.5 |
| 1 | 5.4 |
| 2 | 5.3 |
| 3 | 5.2 |
| 4 | 5.2 |
| 5 | 5.2 |
| 10 | 5 |
| 15 | 4.9 |
| 20 | 4.9 |
| 25 | 4.8 |
| 30 | 4.8 |
| 35 | 4.8 |
| 40 | 4.7 |
| 45 | 4.7 |
| 50 | 4.7 |
| 75 | 4.6 |
| 100 | 4.5 |
| 125 | 4.5 |
| 150 | 4.5 |
| 175 | 4.4 |
| 200 | 4.4 |
| 225 | 4.4 |
| 250 | 4.3 |
| 275 | 4.3 |
| 300 | 4.3 |
According to Cooper (1941) the BCG-MR mixed indicator colours with respect to pH go like this:
- pH 5.2 and above: blue with trace of green
- pH 5.0: Light blue with lavender gray
- pH 4.8: Light pink grey with cast of blue
- pH 4.6: Light pink
- pH below 4.6: Pink or rose
What you’re looking for is the middle ground where the blueness is balanced with the pinkness. The solution will be at its darkest at this point as well. Do your titration, keep track of how much HCl you’ve added, and overshoot slightly. You want the point just before where a small extra HCl addition adds a perceptible amount of pinkness.
This endpoint will work well for all starting alkalinities between 15 ppm CaCO3 equivalents up through 50 ppm. Adjust to be slightly more blue for even lower alkalinities, or slightly more pink for higher alkalinities.
The yellow endpoint for BPB happens at a pH that is too low
The Hanna kit uses BPB and says, “continue adding titration solution until the solution in the plastic vessel turns yellow.” The problem is that BPB doesn’t really turn yellow until the pH gets down to around 3.0 but even at high starting alkalinity the equivalence point doesn’t get lower than a pH of 4.3. This mismatch between colour endpoint and equivalence pH means using BPB yellow as an endpoint will always overestimate the alkalinity of a sample. To be fair, the Hanna kit does say that if results are lower than 100 mg/L (ppm) you can get a more accurate result by starting with 15 ml sample water instead of the usual 5 ml. This will work to a certain extent but still isn’t really right, and I find using 15 ml sample makes the colourimetric endpoint harder to call as well.
Precision titration using 10 mM HCl
The Hanna kit uses 30 mM HCl to titrate the alkalinity. With a 5 ml sample volume being tested each drop of acid (which is between 25 to 30 µl volume) represents a step of at least 8 ppm alkalinity, which is much too large if your starting alkalinity is low. Instead of using more sample volume as Hanna suggests (which is easy) my preference is to dilute the HCl down to 10 mM using distilled water. This requires a little more one-time setup, but the dilute HCl is stable so you can mix it up once and keep on using it and then you can stick with 5 ml of sample test volume. Each 10 µl of 10 mM HCl represents 1 ppm alkalinity and if you’re careful about using fractional drop sizes of acid carefully placed against the side of the testing vessel and then gently swirled in you can reasonably expect to be able to assess in steps of 1 ppm alkalinity – much more appropriate for low alkalinity samples.
Correcting for the alkalinity of the dye
Pretty easy. If you use around 70 µl of 0.1% dye solution added to your 5 ml test sample to get a nice deep colour, the dye contributes about 1 ppm alkalinity. Measure how much 10 mM HCl it takes added to a 5 ml water sample with BCG-MR indicator to get to the lavender-grey endpoint. Your sample alkalinity is that volume of acid in microlitres, divided by 10. As a final polishing correction, subtract the 1 ppm used by the indicator dye to get your final result. So for example, if the colourimetric titration says your endpoint is reached using 250 µl 10 mM HCl for a 5 ml sample, the sample had a starting alkalinity of 250 / 10 = 25 ppm – 1 ppm for the dye = 24 ppm CaCO3 equivalents.
Real world example
Here is a titration of some Shrimphaus water I did using the new method: 5 ml water with about 70 µl added BCG-MR mixed indicator, titrated with 10 mM HCl. Instead of trying to guess the volume of acid added, I just weigh the whole mixture on an inexpensive analytical scale (accurate to +/- 0.005g), tared to the weight of the sample + dye. Easy peasy. Scale says 0.259 at the lavender-grey colour endpoint, that means the sample has an alkalinity of 25.9 (the acid) – 1 (the dye) = 24.9 ppm.


If you step through the photos you can see that I got pretty good at adding really small fractional drops of HCl as the colourimetric equivalence point got close. The really wonderful nature of the mixed indicator also becomes clear. Instead of trying to figure out ‘how yellow is this sample?’ finding where you’re right in between decreasing blue and increasing pink is straightforward. In this example, 0.250 ml HCl is definitely blue and 0.271 ml HCl is definitely pink, so the equivalence point is somewhere between those two. I called it at 0.259 ml, but I can see how there is little interpretive wiggle room. Still, I think with this BCG-MR procedure and some careful working you can comfortably call the alkalinity to +/- 2 ppm with some good confidence.
Less is more – better discrimination with 0.02% dye stock solution
Using 0.1% mixed indicator and adding two or three drops to 5 ml of test water makes a really strongly saturated colour, which seems like it should be a good thing, but lately I’ve been backing off on the dye and like the results better. I now go with a stock solution of 0.02% mixed indicator dye when adding about 75 µl dye makes a starting pale but still very easy to see colour in the test solution. With the lower dye concentration at the equivalence point colour is lost altogether – the solution becomes essentially colourless (super unsaturated faint grey actually). Going slightly beyond the equivalence point is an easily discernible faint pink.
There are two advantages to the reduced dye:
- Apparently the human eye is really really good at detecting ‘some colour’ vs ‘no colour’ which means you can nail the equivalence point very easily without having to decide whether the solution is a bluey-lavenderish-grey vs. hint-of-mauvy-grey.
- The 5 fold reduction in dye means you can essentially ignore the contribution of the dye to alkalinity so no need for a correction factor.
Particularly I have found the reduced dye is helpful when starting with a high alkalinity solution (like Cambridgeshire tap water) where doing a 10:1 dilution with distilled water and testing that puts you right in the sweet spot for the assay. Since you need in this instance to then multiply your measured alkalinity by 10 (reversing the dilution) the correction you would require for a high concentration of dye, combined with the slight uncertainty around colour determination, makes for a double advantage to using less dye.
Blue vs. colourless vs. pinkish
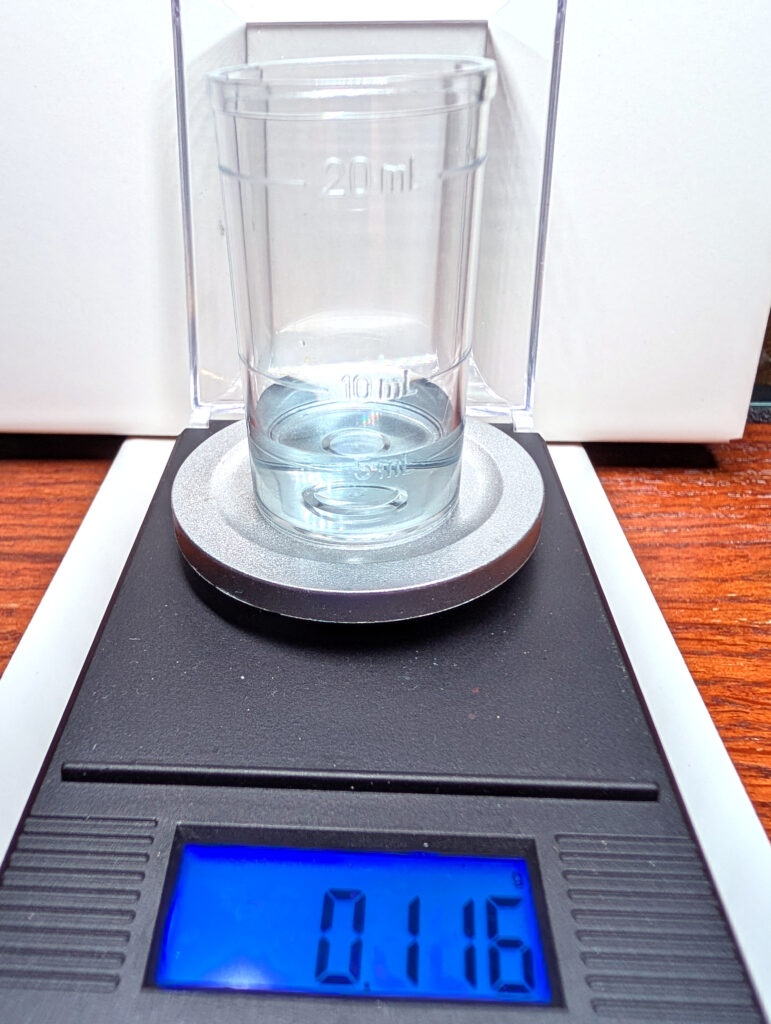
slightly blue at 11.6 ppm
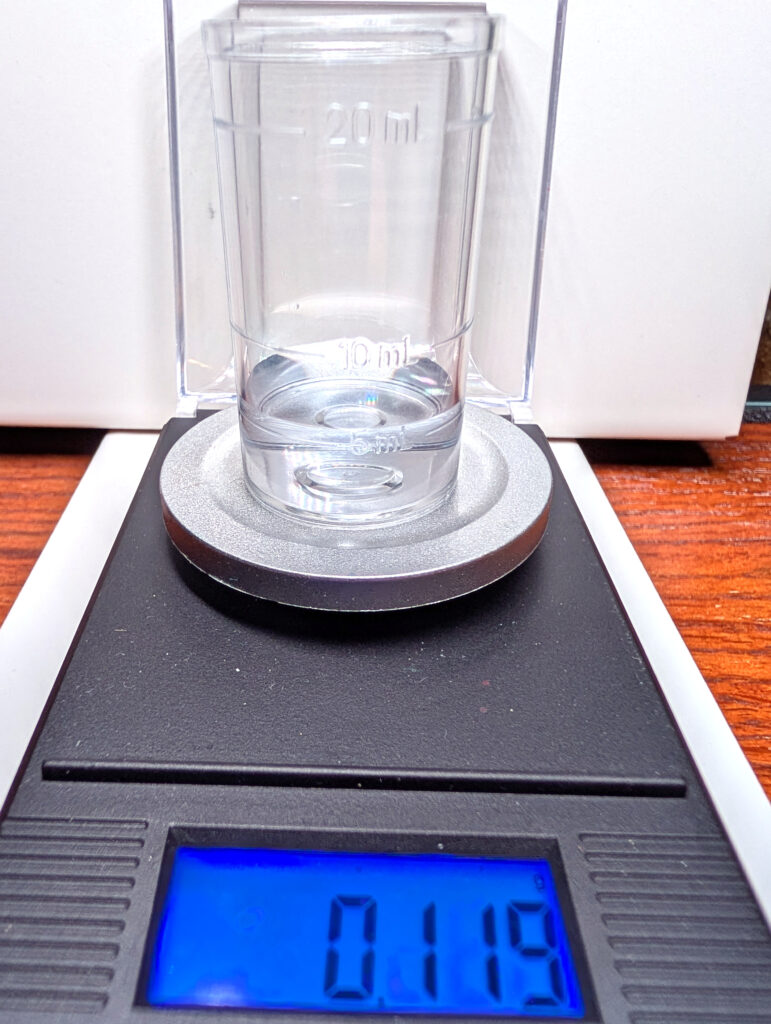
mostly colourless at 11.9 ppm
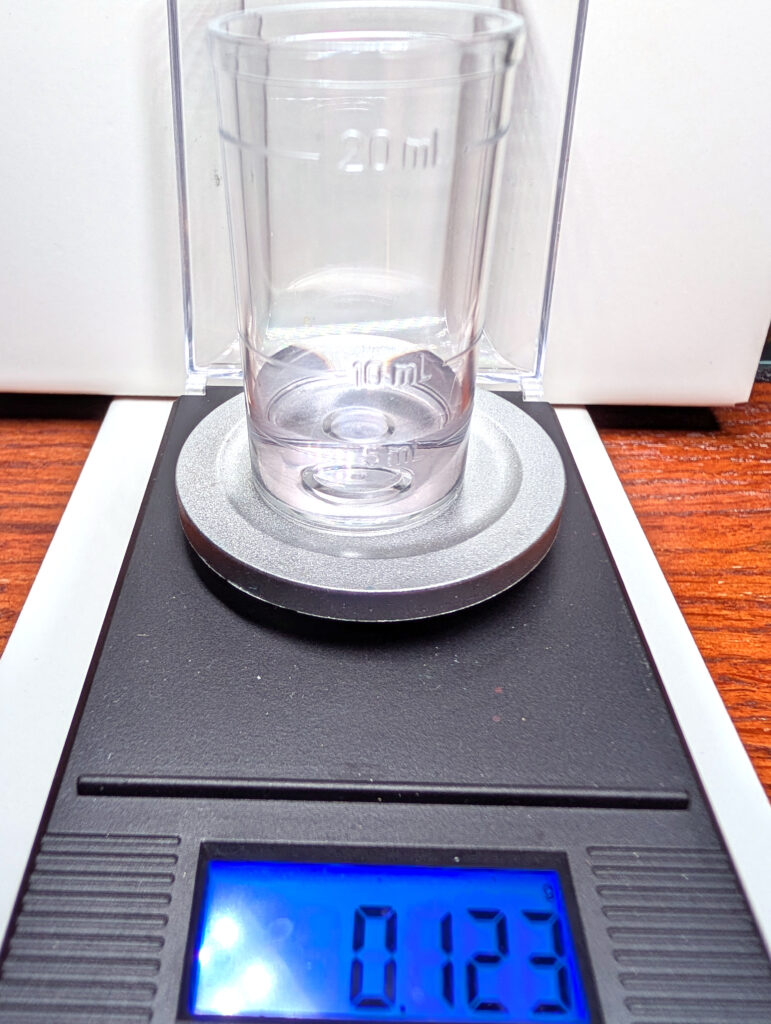
slightly pink at 12.3 ppm
Here is a real world example. I took Cambridgeshire tap water and neutralised nearly all the carbonate alkalinity with HCl. Shown is BCG-MR at 0.02% with a not-trying-too-hard-to-get-the-smallest-possible-drops addition series titrating a 5 ml water sample with 0.01N HCl. After adding 116 µl acid there is a clear residual blue tint. A further 3 µl of acid (119 µl total) removes essentially all the colour. Another 4 µl on top (123 µl total) of that shows pinkish tones. Result: alkalinity is in the neighbourhood of 11.9 ppm ±1 ppm estimated. It’s pretty easy to get down to a drop size of 3 or 4 µl – you could go smaller if you really wanted to but I pretty much take the win here.